
Seattle-Bellevue Market Update | September 2019

The residential real estate market in the greater Seattle-Bellevue metro area has been healthy and steady in 2019 after the May 2018 price correction. Generally, property values are unchanged year over year with some exceptions in some micro-markets (neighborhoods). We continue to have a Seller’s Market with 1.9 months of inventory; less than 3 months is considered a Seller’s Market.
The sale price of condominiums and single family homes increased 11.9% from January 2019 to May 2019 in King County. Currently, I estimate home values will decrease approximately 6% from June through December to approximately 350-355 $/sqft based on seasonal trends. Accordingly, the net annual value increase in 2019 for single-family homes and condominiums in King County is approximately 5.9%, however, there are some exogenous events that could maintain or slightly increase values in Q4-2019. Such values will likely increase again in January 2020. Seattle is ranked in the top 10 U.S. housing markets for 2020.
Hottest U.S. cities for real estate money
New-home u.s. sales rebounded 7.1% in August, flirting again with a 12-year high
Existing-home sales climb for 2nd straight month: National Association of Realtors


The following graph represents the average price per square foot ($/sqft) for single-family homes and condominiums in King County over the last 5 years:

As of August 2019, values are approximately 360 $/sqft, which is -1.1% below values in August 2018 (364 $/sqft). However, August 2019 is +3.9% above values in August 2017, 346 $/sqft.

A major contributing factor to the May 2018 price correction was the Federal Reserve increasing the Federal Funds Rate. On June 14, 2018, the Federal Reserve had increased the federal funds rate for the fourth time in 12 months, which translated to higher borrowing costs. See FOMC chart, https://www.federalreserve.gov/monetarypolicy/openmarket.htm.
exogenous events that could increase property values
Typically, there is a surge in activity from September to October based on seasonal activity. I believe values will decrease between now and year end by approximately 6% from June 2019 (373 $/sqft) to December into the 350 $/sqft to 355 $/sqft range. However, the following are some exogenous events that could maintain value or slightly increase the $/sqft on or before December 2019:
The new NAFTA agreement (USMCA—United States, Canada & Mexico) is passed by Congress. This is anticipated in October. Read more on CNBC >>
The USMCA Could Spur Medical Breakthroughs. Here’s How
Labor Parties to Serve as Deciding Factor in USMCA
FIND YOUR REPRESENTATIVE HERE (CLICK) to request progress
A U.S. trade deal with the China. As I’ve been saying all year, I believe it’s very possible that a trade agreement can be made and its slowly headed in that direction. There are a lot of moving parts to that potentially historic deal. Read more on Reuters >>
There are also other trade deals currently being negotiated with Japan, India, Australia and others.
The Federal Reserve further reduces the Federal Funds Rate, which could translate to lower mortgage interest rates.
A major contributing factor to the May 2018 price correction was the Federal Reserve increasing the Federal Funds Rate. On June 14, 2018, the Federal Reserve had increased the federal funds rate for the fourth time in 12 months, which translated to higher borrowing costs. See FOMC chart, https://www.federalreserve.gov/monetarypolicy/openmarket.htm.

I believe mortgage interest rates will be approximately 3.5% - 3.6% for a 30 year fixed mortgage for the remainder of 2019 and will not exceed 4.25% in 2020.
Freddie Mac: Mortgage rates retreat after highest one-week increase in nearly a year

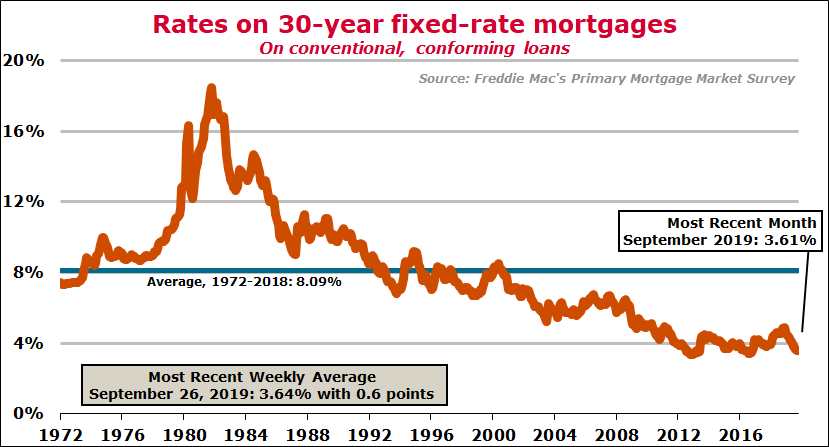

Source: Freddie Mac’s Primary Mortgage Market Survey®. Rate shown is the rate on a 30-year fixed-rate mortgage on a prime conventional, conforming loan with an LTV of no more than 80%. Fees and points associated with these rates are not shown. The average fees and points charged with these rates from 2009 forward has been 0.64 point. These are historical industry figures and don’t necessarily reflect rates offered by WFHM. PMMS data is provided “as is,” with no warranties of any kind, express or implied, including, but not limited to, warranties of accuracy or implied warranties of merchantability or fitness for a particular purpose. Use of the data is at the user’s sole risk.
In local news, the Alaskan Way Viaduct makes way for Seattle Waterfront.
RECENT SEATTLE-BELLEVUE MARKET UPDATES