
Seattle-Bellevue Market Update | July 2019

The Seattle-Bellevue real estate market entered the seasonal “Summer Slowdown” or AKA “Summer Slump” in June 2019 caused by decreased Buyer activity, however we’re still in a Seller’s market. Essentially, the housing market has stabilized and values have nearly recovered their losses from the May 2018 price correction that ended in December 2018 (+/-12.6% dip). I believe home values will flatten-out or gradually increase in most of the micro-markets (neighborhoods) for the remainder of 2019.
It's always fun to read the headlines, but as someone who focuses on the charts, I prefer to use those as my thought driver given they are not giving an opinion, but rather, what actually "is happening".
The following graph for King County outlines single-family home sales (Solds) versus properties on the market (For Sale/Inventory), while also indicating the quantity of properties that have gone under contract (Pended) over the last 5 years:

As previously mentioned in the Seattle-Bellevue Market Update for May 2019, the red curve above indicates the quantity of properties going under contract decreases after May, which indicates Buyer activity begins decreasing. I believe this is attributed to summer vacations, weddings, events and so on. See my article dated July 2017 about this seasonal trend, Relief for Home Buyers during “Summer Slowdown”. However, each micro-market (e.g. Queen Anne single-family homes) is slightly different. For example, many neighborhoods (e.g. West Seattle) have a spike in Buyer activity from late August through September, and thereafter activity continues decreasing until January. See graphs in article Seattle-Bellevue Market Update for May 2019.
The real estate market has been more balanced in 2019 compared to the white hot Seller’s market prior to May 2018, which included a tight supply of less than a month’s inventory. In 2019, the median percent difference of inventory (For Sales) versus Solds was approximately 17.5% as of June 2019. Comparatively, in January 2018 through April 2018, the median percent difference was approximately -4.8%; more Solds (Demand) than For Sales (Supply). Now, the increase in new listings means fewer offers are made on many properties, which allows for more choices and a little breathing room for the backlog of buyers who have been waiting to buy a home.

However, there is approximately 1.8 months of inventory based on closed sales as of June 2019 and less than 3 months is considered a Seller’s market. Therefore, we’re still in a strong Seller’s market. It’s interesting to note before the price correction in May 2018, there was only 0.9 months of inventory as of April 2018, which is half of what it was June 2019.
The following graph represents the average price per square foot ($/sqft) for single-family homes and condominiums in King County over the last 5 years:

Seattle led appreciation rates in the U.S. with 12.7% year -over-year home price increase in 2018. See my article, dated May 21, 2018, Seattle Tops the Nation in Home Price Growth for 18th Consecutive Month. After the May 2018 price correction (see article), homes in King county depreciated from approximately 12.6% from 388 $/sqft to 339 $/sqft, however, home values have appreciated (recovered) over 10% in 2019 from 339 $/sqft to 373 $/sqft.
Investing in real estate is a long-term investment as I mentioned in How to Time the Market and home ownership should be a five to seven year ownership time-frame at a minimum. In June 2014, the average home in King county was 251 $/sqft (average sold price $519,000), which is a value +48.6% value increase today (average sold price $785,000). Also, think of all that potential rental savings and equity built. The market may go up or down in the interim, but the long-term value of your home and land should appreciate as long as its well-maintained and improved upon over time.
Moving forward, I believe home values in the Seattle-Bellevue metropolitan area will flatten-out and may gradually increase in different micro-markets into 2020, if mortgage rates stay low, wages continue to grow at about the same pace as home prices. We can expect the housing market to continue to stabilize throughout the remainder of the year. We should end 2019 better than 2018!
MORTGAGE INTEREST RATES
Joel Kan, MBA's Associate Vice President of Economic and Industry Forecasting said, "Mortgage applications were lower last week, driven by a 3 percent decrease in purchase applications. While purchase activity was still up 6 percent from a year ago, the index has now decreased for three straight weeks and reached its lowest point since March. Despite healthy demand, inadequate supply levels continue to hold back some would-be buyers.
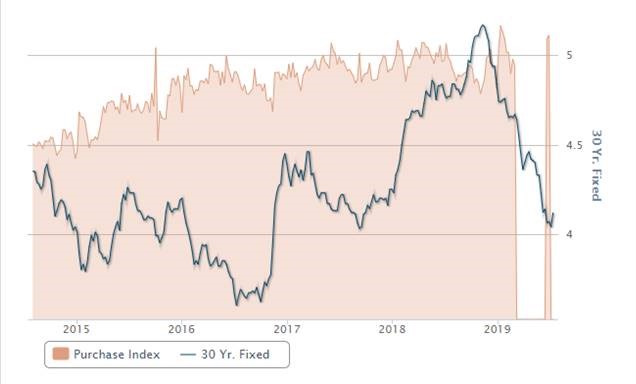
"Rate movements were mixed," he said, "with the 30-year fixed rate remaining unchanged (at 4.08 percent), but the FHA rate decreasing to its lowest level since 2017 to 3.94 percent."
FEDERAL RESERVE
The Federal Reserve cut interest rates on July 31, 2019 by a quarter-percentage point—the first reduction since 2008—in a pre-emptive strike to cushion the economy from a global slowdown and escalating trade tensions. It also appears this Federal Reserve rate cut (25 basis points) is in response to their over-correction (rate increases) beginning in March 2018 that contributed (exacerbated) to the May 2018 price correction. See graph below. I wouldn’t be surprised if there’s another 25 basis point rate reduction in 2019.

Also, the unemployment rate, at 3.7% in June, is near a half-century low. The U.S. economy expanded at a 2.1% seasonally adjusted annual rate in the second quarter, buoyed by strong consumer spending. Also, stocks have been near records, largely in anticipation of Fed rate cuts.
But, several sectors of the U.S. economy are slowing, including manufacturing. Others, such as housing, have rebounded this year due to the Fed’s decision to abandon rate increases at the beginning of the year.
It’s pretty amazing how well the U.S. economy is doing with some ongoing headwinds (e.g. trade issues with China). I still believe China and the U.S. will reach a mutually agreeable deal at some point...it may be in stages. I think a deal could happen in the next 6-12 months. The global economy would be cooking with gas, if this happens! Good for all.
RECENT SEATTLE-BELLEVUE MARKET UPDATES