
Seattle-Bellevue Market Update | June 2019

Home price gains are reportedly slowing nationwide. “Home price gains continued in a trend of broad-based moderation,” says Philip Murphy, Managing Director and Global Head of Index Governance at S&P Dow Jones Indices. “Year-over-year price gains remain positive in most cities, though at diminishing rates of change. Seattle is a notable exception, where the YOY change has decreased from 13.1% in April 2018 to 0.0% in April 2019. See press release on June 25, 2019.
The May 2018 price correction caused home values to decrease and eventually level off in December 2018 to January 2019. See the article I posted in September 2018 on What to Make of Seattle’s Market Cooldown.
As mentioned in last month’s market report, I believe home prices will continue to gradually increase in the future, but at a slower rate of growth. See article I posted in November 2017, on Slower (Not Lower) Home Price Growth.
If we conservatively assume a 3% to 5% appreciation rate, which is the national average, a $1.5M property purchased now will be valued at approximately $1.73M to $1.9M, after 5 years. However, such appreciation rates are subject to exogenous events including recession, Federal Reserve monetary policy mistakes, trade, geopolitical matters etc that could adversely affect real estate values. Note it seems the Fed will reduce the Fed Funds rate in July, which could translate to lower mortgage interest rates.
On June 27th, Lawrence Yun, NAR chief economist, said consumer confidence about home buying has risen, and he expects more activity in the coming months. “The Federal Reserve may cut interest rates one more time this year, but there is no guarantee mortgage rates will fall from these already historically low points,” he said. “Job creation and a rise in inventory will nonetheless drive more buyers to enter the market.” See National Association of Realtors article.
Currently, home values in the greater Seattle-Bellevue metro area are generally what they were a year ago, but have been trending upwards since January. However, each micro-market varies slightly.
May 2019 was a Seller's market for King County
Home For Sale in May 2019: 4551 units.
•Up 22.9% compared to April•Up 62.1% compared to last year
Home Closed in May 2019: 2729 units.
•Up 17.1% compared to April•Up 4% compared to last year
Home Placed under Contract in May 2019: 3085 units.
•Up 11.5% compared to April•Up 6% compared to last year
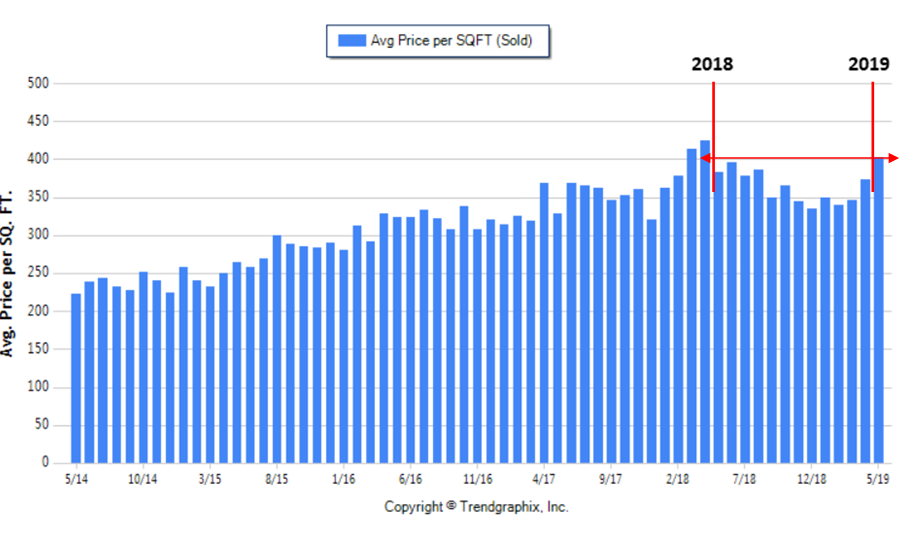
The graph below indicates the average price per square foot ($/sqft) for single-family homes in King county over the last 5 years:

The average $/sqft was 373 in May 2018 while the average was 370 $/sqft in May 2019 in King county as a whole, which is a decrease of less than 1%.
*Note valuing a property based only on square footage (i.e. dollar per square foot) is not an accurate method for single-family properties—there are many factors to consider in concert together. For example, if you were only going to rely on square footage as a value metric, that would only apply to condos in the same building, with similar views, within a few floors of each other with similar updates and same wear and tear (e.g. rental versus primary residence).
The graph below indicates the average price per square foot ($/sqft) for single-family homes on the Eastside, Bellevue west of the 405 over the last 5 years:

Please be aware there is not as much data for Bellevue west of the 405 as there is for King County, which includes 85 zip codes, so trends are not as apparent. The average $/sqft was 692 in May 2018 while the average was 654 $/sqft in May 2019, which is a decrease of approximately 5.5%.
The graph below indicates the average price per square foot for single-family homes in West Seattle’s zip code 98126 over the last 5 years:
*Note average $/sqft was 215 in Q1-2012 and the average in Q1-2019 was 359 $/sqft, which is a 67% increase.
The average $/sqft was 383 in May 2018 while the average was 402 $/sqft in May 2019 in zip code 98126, which is a 5% increase. There is strong demand for north West Seattle. New construction homes in north West Seattle (e.g. North Admiral, Genesee, etc) are approximately $1.7M (reference here).
The average single-family home sold price in zip code 98126 in May 2019 was $732,000 while the average sold price was $690,000 in May 2018, a 6.1% increase. Note the average single-family sold price in the city of Seattle—as a whole—was $895,000 in May 2019, which is a 5.7% decrease relative to May 2018, $949,000.
Federal & local affordable housing measures
U.S. President SIGNS EXECUTIVE ORDER TO TACKLE LACK OF AFFORDABLE HOUSING ON JUNE 25,2019.
Government over-regulation reportedly accounts for an estimated 25% in additional costs to home owners.
national association of realtors Applauds Administration's Actions to Increase Americans' Access to Affordable Housing
Mortgage bankers association (MBA) Statement on President’s Executive Order on Housing Affordability
national association of homebuilderS (NAHB) statement on Housing Affordability Executive Order
Seattle approves more backyard cottages
mortgage interest rates
"Markets last week reacted to a more dovish FOMC statement and forecast, with Treasury yields falling after the meeting. Mortgage rates dropped again for most loan types, which led to an increase in refinance activity, partly driven by a 9 percent jump in VA applications," said Joel Kan, MBA's Associate Vice President of Economic and Industry Forecasting. "The 30-year fixed rate has now dropped in three of the last four weeks, and at 4.06 percent, reached its lowest level since September 2017. Despite these lower rates, purchase applications decreased 2 percent, but were still considerably higher (9 percent) than a year ago."
Added Kan, "Now at almost the half-way mark of 2019, we have generally seen a stronger purchase market than last year, despite still-tight existing inventory and insufficient new construction."